Incorrect, misleading and potentially dangerous.
This is our letter to Pete Sparrow, CCC General Manager Building Control and Rebuild and Mike Stannard, Chief Engineer, MBIE. We request that this document is revoked and the PMO’s and the public notified.
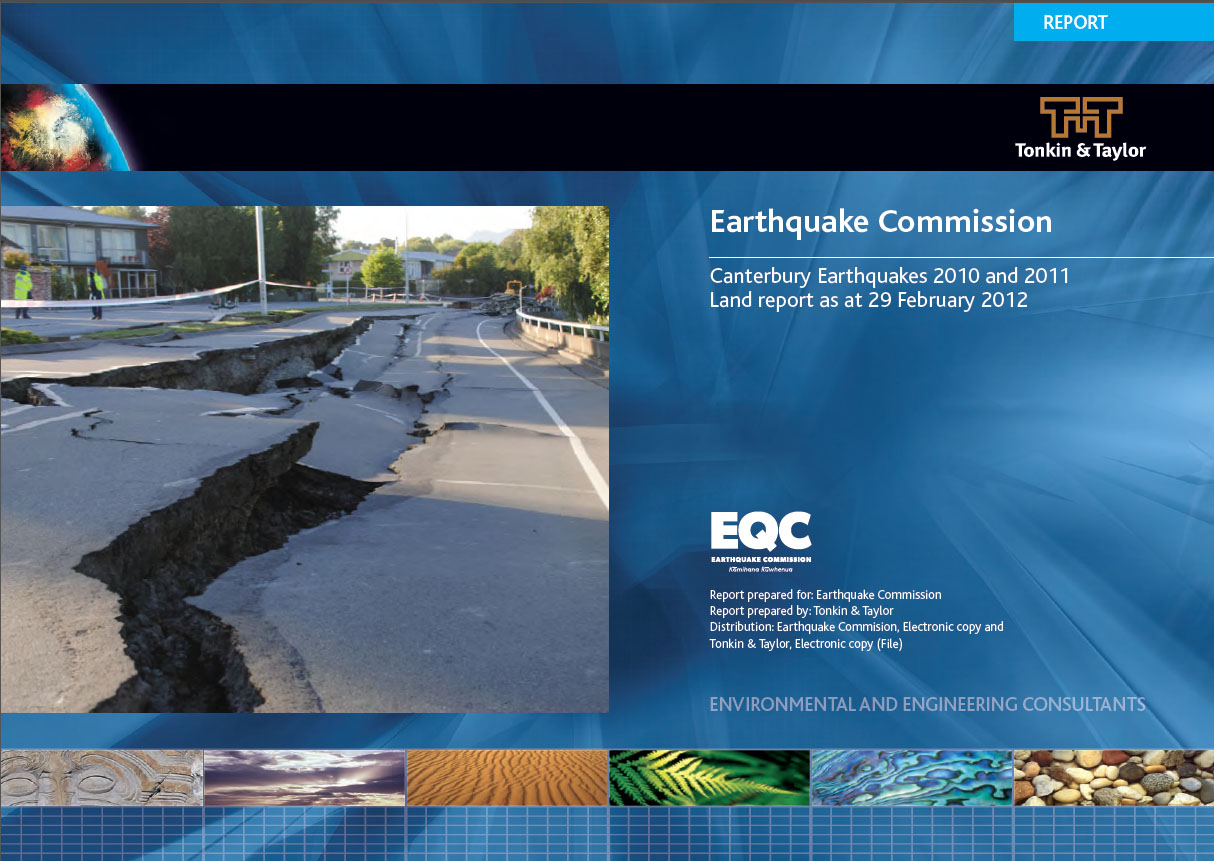
Christchurch 10. June 2014
I am writing to you to point out that a document which is being used as a reference for the current land status in Christchurch is incorrect, misleading and potentially dangerous.
Using this document as a main reference for current land conditions can lead to the negligent practices that have been witnessed in Christchurch.
On the EQC website where this document resides the following incorrect statement is made “Please note: The information in this report is up to date as of 29 February 2012: it does not take into account any aftershocks or earthquakes that occurred after that date.” This document is not up to date as it does not include up to date information as of 29 February 2012.
As evidence for this contention, I would point out the following:
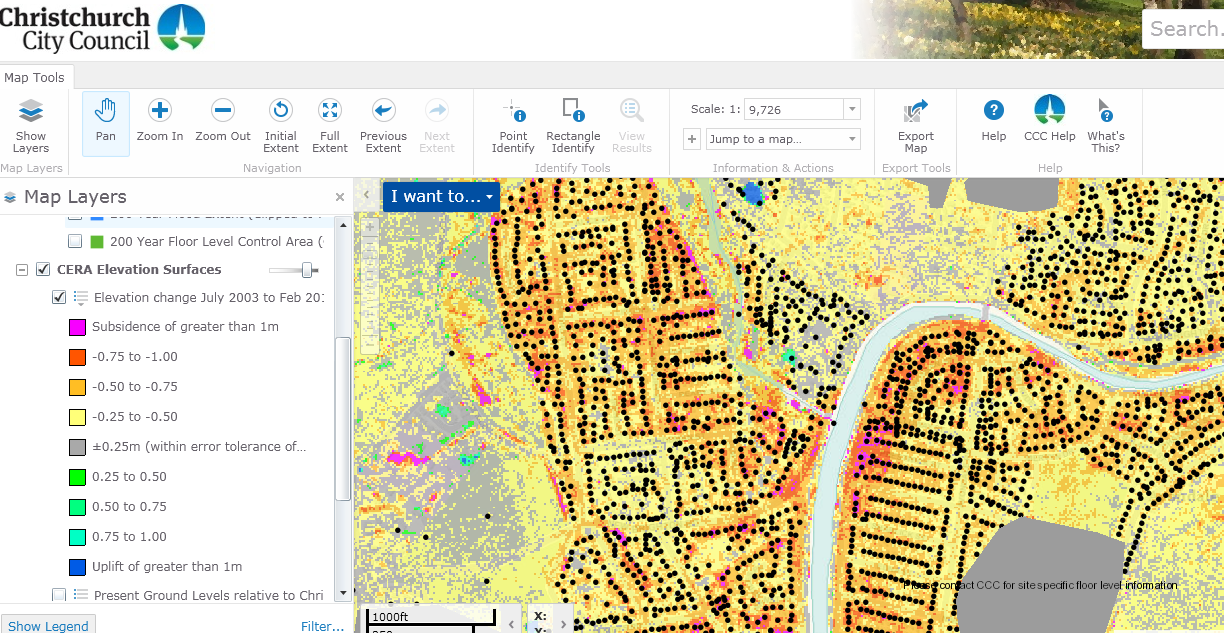
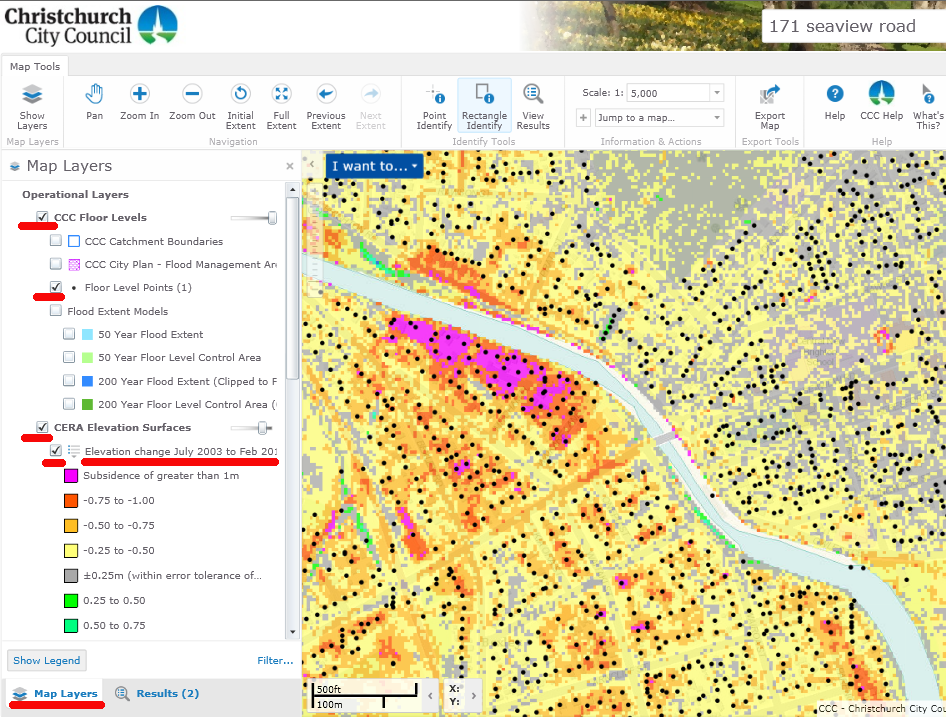
- All the maps published in this document are outdated and do not reflect current land conditions. The maps are dated June 2011, after which we had over 100 earthquakes of magnitude 4 and greater.
- Significant levels of subsidence in the eastern suburbs of Christchurch and further land damage have been ignored.
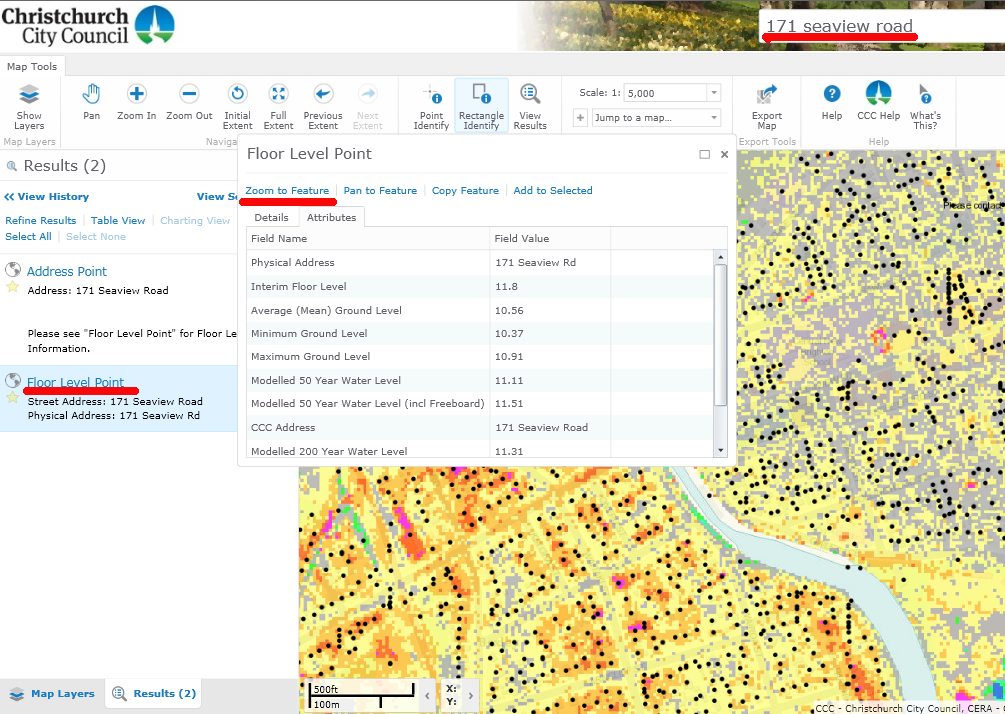
- All the statistics given for elevation and groundwater levels are misleading as they exclude most of the worst land damage. As an example I refer to the statistics published for the suburb of South Brighton.
- Average subsidence is stated to be 50 mm. In fact, the worst affected properties have subsided by up to 1000 mm, which is 20 times the amount stated.
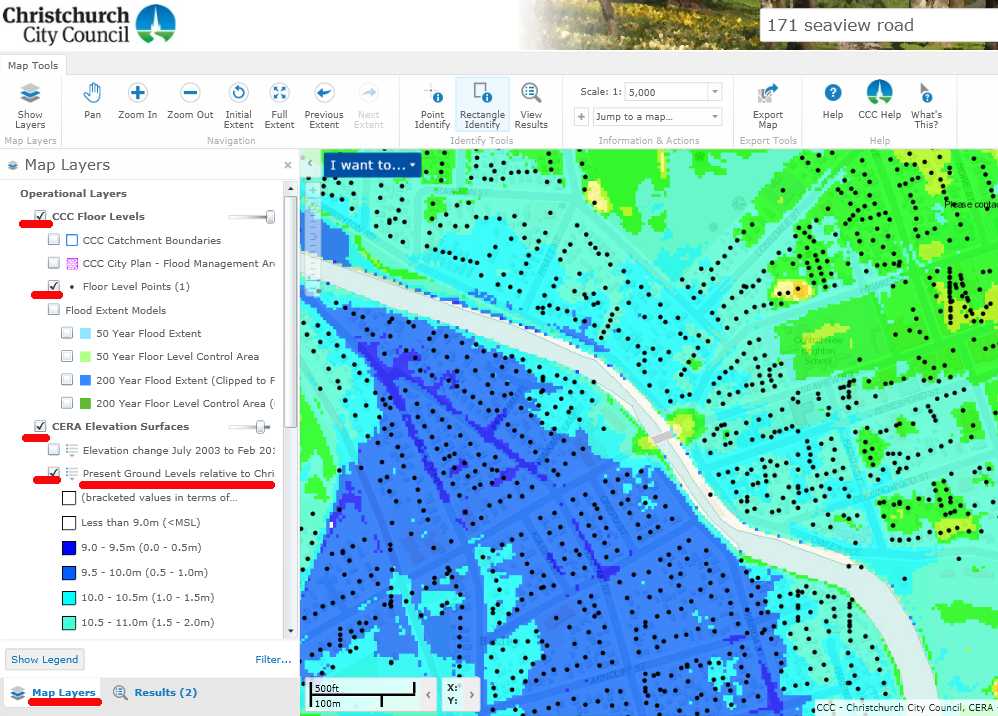
- Groundwater is stated to be at 130 cm on average from the surface, whereas measurements show that groundwater is as little as 10 cm from the surface in places, and is both saline and tidal.
- Many properties have subsided below the height of the Mean High Water Spring (MWHS) and, pursuant to the provisions of the Marine and Coastal Area Act 2011, the land has therefore been divested.
Using this document as a reference in preparation for any repair or rebuild leads to unsustainable and even dangerous practices.
This document has an extensive disclaimer and no liability is assumed.
This has been pointed out to both Tonkin and Taylor and the EQC.
Even though Tonkin and Taylor has confirmed in writing that 140 properties in South Brighton have subsided in excess of 250 mm before this document was published and have been excluded from the statistics in this document, the document is still used as a reference for recovery.
What I have seen in practice is that high groundwater, liquefaction vulnerability and severe lateral spreading have been ignored in geotechnical reports on land that has suffered in excess of a metre (correction) of lateral spreading and significant subsidence, land that has been identified as being highly vulnerable to liquefaction . This has led to unsuitable repair methods being proposed. There is ample evidence of such methods having been implemented.
Based on this document, it has been assumed that the land can be defined as “good ground”.
I request that this document be immediately revoked and that all Project Management Offices and the public are notified as a matter of urgency that it no longer applies.
The consequences of using incorrect data has become obvious with current flooding in Christchurch.
While the Stage 3 report is not specifically mentioned in the MBIE guides, there are references to also outdated stage 1 and stage 2 land reports.
None of these references are reliable as a reference material for current land conditions and should be specifically be identified as unsuitable reference documents for current land conditions.
I await your confirmation, or any evidence to the contrary, showing that these reference documents used for the recovery reflect the current land conditions.
Please confirm receipt of this email.
Best regards,
Hugo Kristinsson
Founding member of the South Brighton Residents’ Association
Founder of Empowered Christchurch