
CCC Elevation changes
Christchurch City Council and CERA have by request added two new layers to the floor levels map.
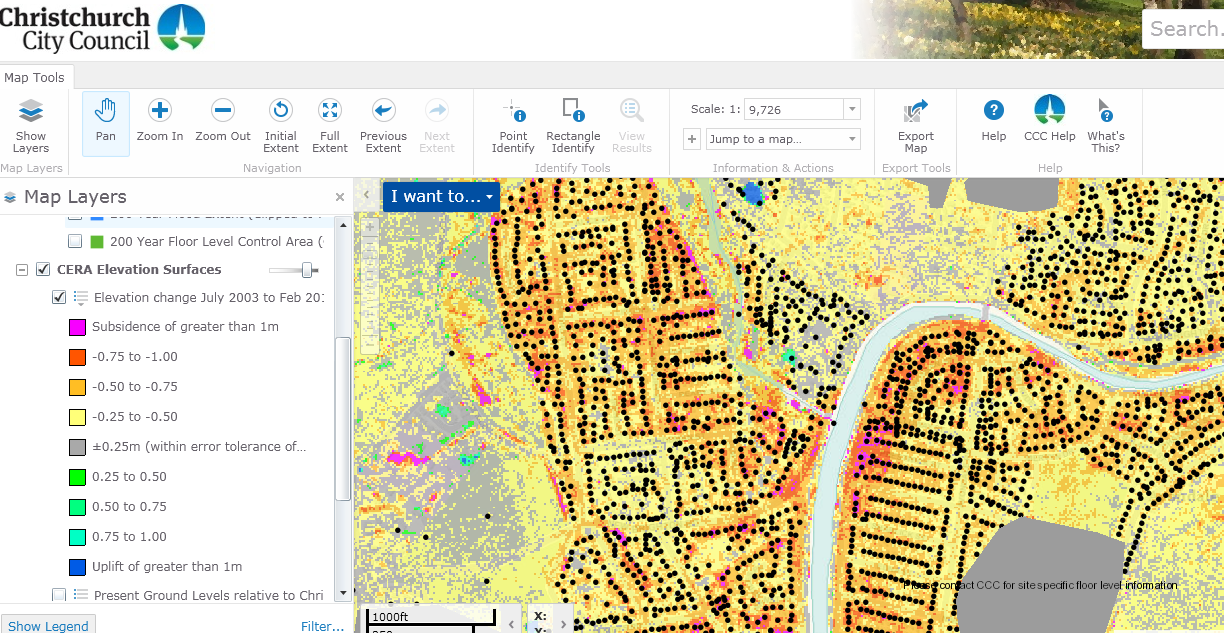
First one includes elevation changes pre and post earthquakes.
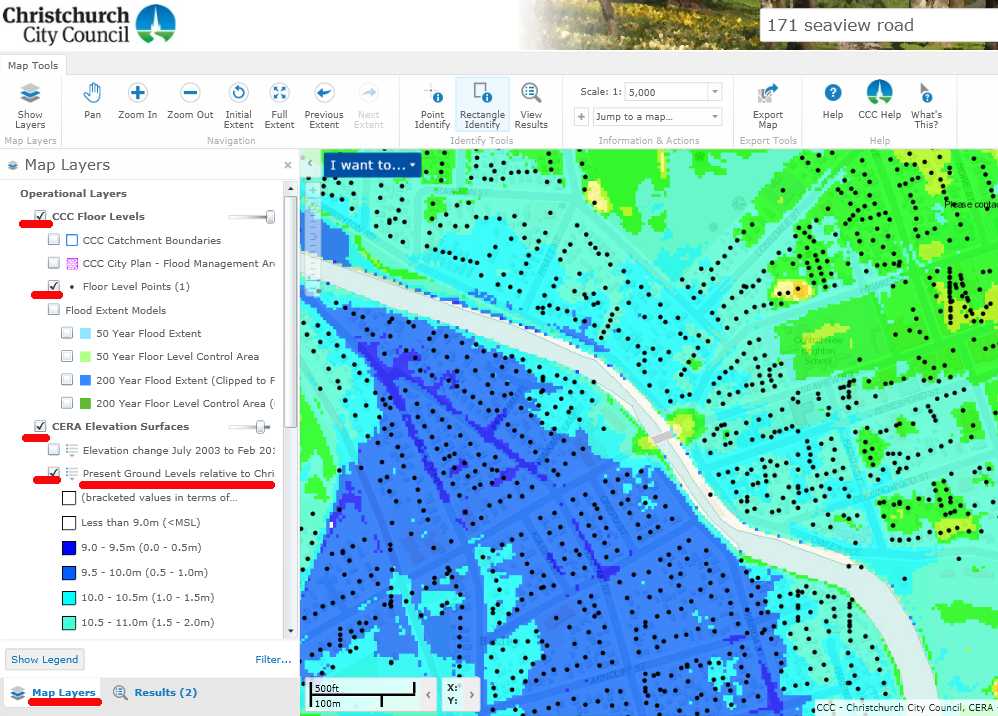
The second one shows current elevation of the land.
Clicking on the right side on the tick button expands to show definition of the colors.
this map
Instructions below.
Enter site. this map
If required install Silverlight software. Accept terms to get access to maps.
Type in your address at top right corner. Hit enter.
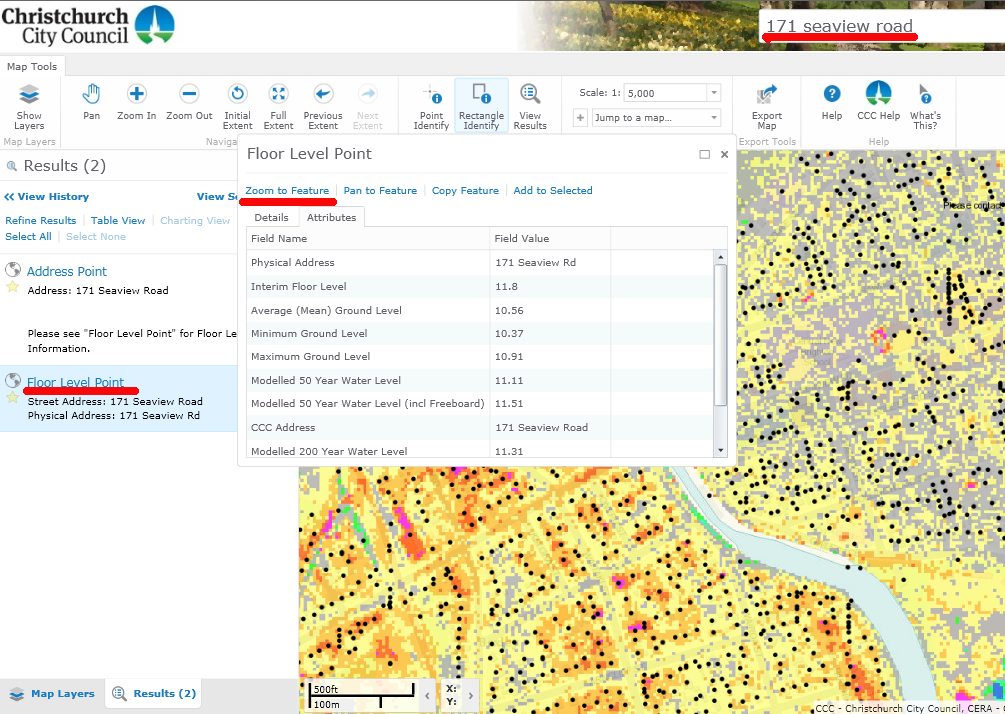
On the left side of the screen you will see a few listings including floor levels for the specific site you are looking for.
Click on the listing, a box will display with relevant height information.
Click on zoom to feature.
Now you have current elevation and food predicted height and planning requirements in regard to floor levels.
Now select map layers at the bottom left corner.
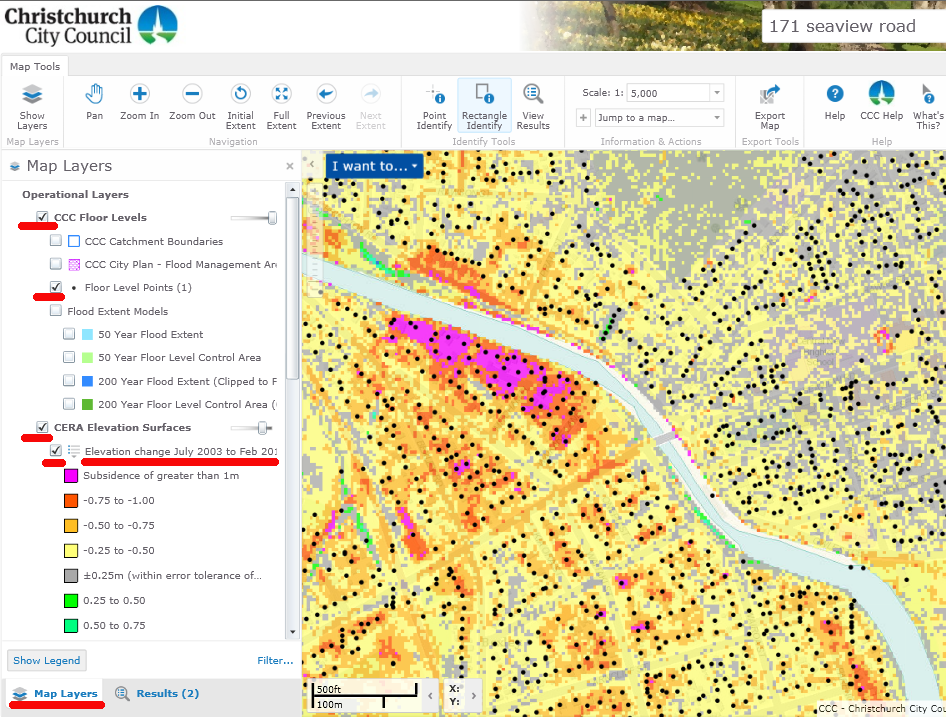
Make a selection as per the images to see current elevation and elevation changes.
Keep in mind that the information does not substitute a proper site survey by a professional surveyor.
For example the gray area is displayed as +/- 25cm.
That equals 50cm error probability.
50 cm equals predicted sea level change for the next 50 years.
Durability requirements for a new building is 50 years.
Hi Hugo, Can you give an actual link to the floor levels layers additions- all I can get is a screen shot when I click on anything that looks like a link or hyperlink from here. Have tried going through the council’s site and links but when I click on “accept” for the disclaimer box everything comes to a screaming halt, it almost appears that performing this action disconnects rather than connects you to the page, I have firelight 5.1 but still won’t connect to the sight- thanks Bryce
Hi Bryce, Try installing silverlight from Microsoft. This sounds like a plugin failure.
http://www.microsoft.com/silverlight/
I hope this helps. Otherwise let me know and I can help you with some screenshots of your property.
Hugo
Hi Hugo, can you tell me why the data is only available for a certain area of Christchurch? It appears when I search the Cera/CCC Land sinking/rising map data only appears up to Barrington Street in the South West.
It appears that they have no data for our area in Hoon Hay and further South, did they assume we did not sink/rise?
This is new growth area for Christchurch, kind of scary if no one knows whether the land was susceptible to bouncing in earth quakes.
In particular we are close to the end of Darfield Fault and the Port Hills Fault, with both the Halswell and Heathcote rivers starting out this way along with the run off from the Port Hills (ponding area).
Vivienne Watts
Hi Vivienne,
I am very concerned about lack of transparency as new subdivisions are taking place there and the land is suspect.
It would be best to call council and ask them to explain why this information is not inclusive.
You should be able to find some information here.
https://canterburygeotechnicaldatabase.projectorbit.com/Maps/EQC/TT-LiquefactionVulnerabilityStudy.htm
There are LiDAR maps of pre and post earthquake elevation on this site.
This map below shows predicted settlement if we have what is called ULS event. Peak Ground Acceleration of 0.35 PGA.
https://canterburygeotechnicaldatabase.projectorbit.com/Maps/EQC/LVS/Figure%20I17.pdf
Let me know if you need any assistance with this.